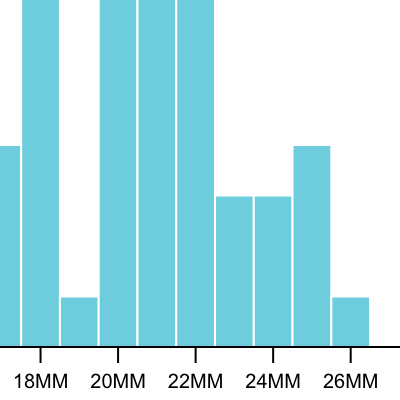
 For a coding interview I was tasked with predicting the qualifying offer for a given year. The qualifying offer is a one year contract teams can offer calculated by averaging the top 125 salaries* paid in the previous year.
I was given a URL to hit which responded with a dataset consisting of players and their salaries. The data was inconsistent and some values were missing. Also the URL was not CORS enabled. The parameters of the challenge were to spend a few hours making a site that would display the data and calculate the estimated qualifying offer for the following year.
I use a serverless function to proxy the data to a React app. I was tempted to build my own graphs and tables, but since I was given a shorter amount of time I chose to leverage open source modules that helped accomplish the tasks efficiently.
I think this task shows that I can effectively display data in a limited amount of time. Given more time I would have added some features to the graph, most notably adding a line representing the predicted qualifying offer.
*Some specifics of the calculations have now changed.
View
View the finished product here.
Code
View the code on GitHub